By Charles-Alexandre Delestage & Willy Yvart
Virtual reality has already met art and culture in its recent growth. Emotions, as an important part of everyone’s relation to the world, could give precious insights to favour its further development.
Emotion studies, if somewhat on hold for most of the 20st century, now get a renewed production in scientific studies as well as a certain interest for the public (Chauvaud et al. 2021). As (Damasio 1995) showed, emotions take a not so minor role in decision making, and in a broader sense, in cultural enjoyment. This key role gives root to experience scoring, as to guide cultural institutions and creative management in order to evaluate and promote successful exploitation of cultural works of art.
Virtual reality, even though it is not as a new technology as it may seem – as it started in the 70’s –, gets an increasing production of cultural experiences since the availability of consumer grade models since the 10’s. The recent creation of the CNXR in France as well as the Euromersive association in Europe, to give voice to virtual reality creators and producers, are shinny examples of the emergence of a dynamic ecosystem for cultural experiences. In particular, the increasing usage of virtual reality in renowned museums and patrimonial settings is representative of this development (Mona Lisa: Beyond The Glass, Eternelle Notre Dame, The Scream VR, Lady Sapiens, etc.)
If emotions have been studied mainly through its physiological aspects, via numerous devices – ECG, electrodermal density, etc. – it appears to us that these approaches lack a key aspect of emotions: its quality. To assess the psychological part of one’s emotion, we designed back in 2014 a simple tool known as Spot Your Mood, based on (Russell 1979; Scherer 2005) works on an abstract representation of the emotion space. The abscises represent the valence (unhappy – happy), while the ordinates represent the arousal (sleepy – fully awaken). What is asked to the participant is simply to point on the diagram where he/she feels being. The coordinates can be recorded on paper with a pencil or electronically if used on a smartphone. As tested via multiple studies, this tool can adequately transcribe one’s emotional state, and provide room for analysis either on pre/post completion of the diagram or with the possibility to freely point at the diagram anytime during the experimentation.
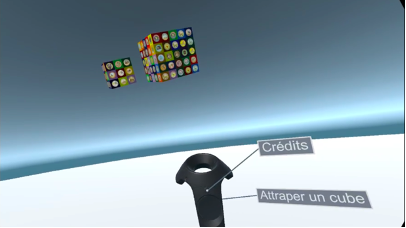
For our exploratory experimentation, we evaluated a VR research demonstrator exploiting the collection Garnaud from the Musée du Papier in Angoulême. Part of the collection was digitalized and dispatched by theme on colorful cubes evoking the famous Rubik’s cube. The user can bring the cubes to him/her and expand each piece to see its different iconographic layers.
Figure 2: illustrations of the VR demonstrator
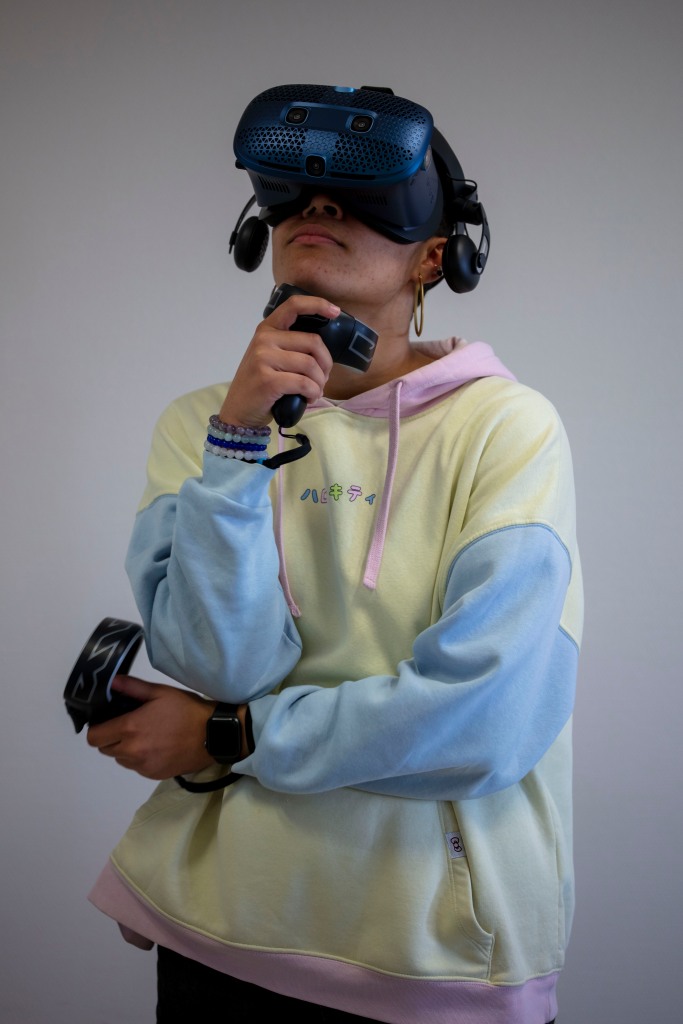
The protocol used the Spot Your Mood tool before and after the VR journey, as well as questionnaires to learn about the participant’s habits in terms of museums, video games and VR, and to gather its reactions and feelings on the demonstrator. In addition, all participants were filmed in reality to follow their evolution in real space and in VR. For analysis, we focused on the delta between the two pointing before and after VR – describing the emotional induction of the experience – and compared it to the reactions in the questionnaires as to provide clusterization of the users in terms of their experience. Each cluster have a converging opinion regarding the experience, even though the global tendency was too stretched to be conclusive.
We were able to distinguish four main groups plus some outliers. The group in blue, we called ‘unmoved’, are notable for a delta negligible and a shorter time spent in VR than the others, with high mobility in space, meaning these people were not captivated by the experience. The group in yellow – ‘amused’ – moved toward the acceptance zone of the valence-arousal space, with very homogenous responses to the questionnaires and time spent in VR indicating a positive experience. The red one – the ‘exhausted’ – are characterized by a long time spent in VR, yet without a strong deviation from the general consensus.
Figure 3: Delta based on the Spot Your Mood pointing of the participants. Units represent the delta value for each axis.
The ability to visualize these clusters of experience, with a discretization of the emotional inductance and opinion about the experience could be one step toward experience scoring. The fact one could synthetize a cohort experience with simple tools relying on visual interpretation as well as quantified subjective inputs would simplify the evaluation of cultural productions in VR, which are now still looking for a viable economic model. It also provides institutions with affordable ways to evaluate the subjective experience of their visitors, to go further than counting the number of visitors and session time in the experience.
References
CHAUVAUD, Frédéric, DEFIOLLE, Rodolphe, VALETOPOULOS, Freiderikos et BRIAND, Michel, 2021. La palette des émotions: comprendre les affects en sciences humaines. Rennes : Presses universitaires de Rennes. Essais. ISBN 978-2-7535-8256-9. 152.4
DAMASIO, Antonio R, 1995. L’erreur de Descartes: la raison des Emotions. Paris : O. Jacob. ISBN 978-2-7381-1713-7.
RUSSELL, James A., 1979. Affective space is bipolar. Journal of personality and social psychology. 1979. Vol. 37, n° 3, pp. 345.
SCHERER, Klaus, 2005. What are emotions? And how can they be measured? Social Science Information. 2005. Vol. 44, n° 4, pp. 695‑729. DOI 10.1177/0539018405058216.
About this article
DELESTAGE, Charles-Alexandre et YVART, Willy, 2021. Expérience vécue et réalité virtuelle : méthode visuelle d’analyse sur la base d’enregistrements vidéo et du diagramme de Valence-Arousal. In : Colloque International Méthodes Visuelles en Sciences Sociales. Université de La Laguna, Tenerife, Espagne : to be published.
About the authors
Charles-Alexandre Delestage is post-doctoral researcher in Information and Communication Sciences at the FABRICC – University of Poitiers team, an interdisciplinary research group working on the Creative and Cultural Industries. He is also associated to the ELLIADD lab at the University of Bourgogne Franche-Comté.
Willy Yvart is associate professor in Information and Communication Sciences associated to the ELLIADD lab at the University of Bourgogne Franche-Comté.
About the illustrations
Illustration credit: Julien Langlois, Daniel Kirwan-Baez et Manon Ebandza
All images contained in this article are produced by the researchers using analysis softwares or the research demonstrator created by Charles-Alexandre Delestage. The images represented by the demonstrator are the property of the Musée du Papier, Angoulême, which provided them freely for research purposes.


Leave a Reply